.png)
Updated September 1, 2026: A follow-up analysis has qualified one of this report's conclusions. The finding that payment predicts attendance holds, but the effect is substantially weaker at the individual level than this report implied. See the addendum at the end.
Reports #02 through #04 in this series focused on optimizing registration completion: reducing ticket complexity, organizing choices with categories, and demonstrating that form length doesn't hurt. The implicit assumption was that higher completion is better.
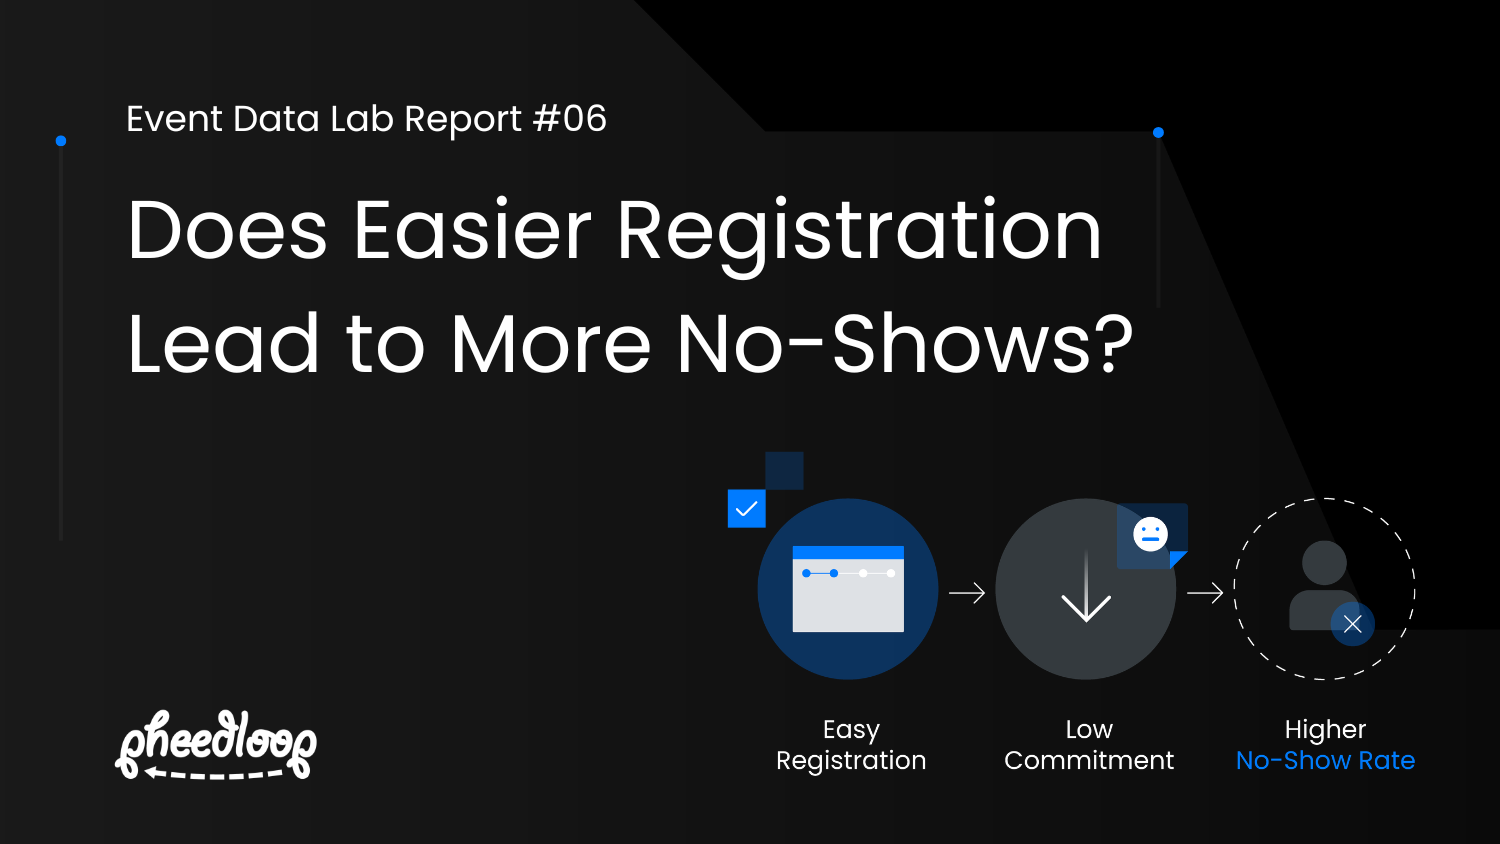
But is it? If easier registration attracts people who never intended to show up, optimizing for completion may not be optimizing for attendance. In this Event Data Lab report, we cross-referenced registration data from the first four reports with check-in data to test whether registration friction predicts who actually attends.
Executive Summary
- Events with the highest registration completion rates (90-95%) show a median no-show rate of ~29%, compared to ~17% for events with below-70% completion. At the surface level, easier registration correlates with worse attendance.
- However, this relationship is almost entirely explained by whether the event charges admission. Free events have both higher completion (~96% median) and higher no-shows (~28%). Paid events have lower completion (~86%) and lower no-shows (~17%).
- When controlling for pricing, the completion-to-attendance relationship disappears. Among paid events only, no-show rates are flat (~16-19%) regardless of registration completion rate. Payment, not friction, is the commitment filter.
Dataset Overview
Dataset overview
- 860+ events with both registration data and check-in data
- Cross-references the registration dataset from Reports #01-#04 with check-in data from Report #05
- Same exclusion criteria: test events removed, minimum volume thresholds applied
- Data aggregated and anonymized across live events
Metric definitions
Registration completion rate: completed registrations / total registration attempts. Measures conversion within the registration flow.
No-show rate: 1 - (check-ins / total expected attendees). Measures the gap between expected and actual onsite attendance.
What the Data Shows
The Surface-Level Pattern: Completion and No-Shows Move in Opposite Directions
Across all events, higher registration completion is associated with higher no-show rates.
No-show rates by registration completion band
- Below 70% completion: ~18% median no-show
- 70-80% completion: ~17% median no-show
- 80-90% completion: ~20% median no-show
- 90-95% completion: ~29% median no-show
- 95-100% completion: ~21% median no-show
The sharpest spike is in the 90-95% band, where no-shows jump to 29%. Events with the most friction (below 70% completion) have the lowest no-show rates.
This pattern appears to confirm the "friction filters for commitment" hypothesis: harder registration produces more committed attendees.
The Ticket Count Inversion
The same inversion appears with ticket count.
No-show rates by ticket count
- 0 tickets (no selection): ~34% median no-show
- 1 ticket: ~23% median no-show
- 2-3 tickets: ~22% median no-show
- 4-5 tickets: ~18% median no-show
- 6+ tickets: ~17% median no-show
More ticket types are associated with lower no-shows, the exact opposite of their relationship with registration completion (Report #02). Events with no ticket selection have the worst attendance.
The Confound: It's About Payment, Not Friction

Before drawing conclusions about friction as a commitment filter, examine what differs between high-completion and low-completion events.
Free vs paid event profiles
- Free events: median registration completion ~96%, median 1 ticket type
- Paid events: median registration completion ~86%, median 8 ticket types
Free events have higher completion because there is no payment step. Paid events have lower completion because ticket selection and payment add friction. These are the same two groups showing different no-show rates.
When you control for pricing, the completion-to-no-show relationship collapses.
No-show rates by completion band, paid events only
- Below 70% completion: ~18% no-show
- 70-80% completion: ~16% no-show
- 80-90% completion: ~18% no-show
- 90-95% completion: ~19% no-show
- 95-100% completion: ~16% no-show
Flat. Among paid events, registration completion has no observable relationship with no-show rates. Whether a paid event completes at 65% or 98%, roughly the same proportion of registrants show up.
No-show rates by ticket count, paid events only
- 0-1 tickets: ~18% no-show
- 2-3 tickets: ~21% no-show
- 4-5 tickets: ~17% no-show
- 6+ tickets: ~17% no-show
Also flat. Among paid events, ticket count does not predict attendance.
Key insight: Registration friction does not independently predict attendance. The apparent relationship between harder registration and better attendance is driven by the free/paid distinction, not by friction itself. Payment is the commitment mechanism. Event teams should continue optimizing registration for completion without concern that easier flows will increase no-shows, provided the event charges for attendance.
What This Means for the Series
This finding does not invalidate Reports #02 through #04. Optimizing registration completion is still the right goal for the registration flow. What this report adds is the second metric: attendance. The two metrics are driven by different mechanisms.
Registration completion is shaped by choice architecture (Reports #02, #03, #04). Attendance is shaped primarily by financial commitment (this report). Optimizing for one does not harm the other, at least among paid events.
For free events, the picture is less clear. Free events have both high completion and high no-shows, and the data is not sufficient to determine whether adding friction to free event registration would improve attendance. What is clear is that the absence of payment is the primary driver of no-shows, not the ease of the registration process.
Practical Implications for Event Teams
- Continue optimizing registration flows for completion. Among paid events, easier registration does not produce more no-shows. The findings from Reports #02 through #04 remain valid.
- Recognize that no-show rates are primarily driven by pricing model, not registration design. If your event has a no-show problem, the most effective intervention is likely related to pricing or commitment mechanisms, not to adding registration friction.
- Free event organizers should plan for materially higher no-show rates (~28%) regardless of registration flow design. Consider strategies that create commitment without payment: requiring confirmation, adding calendar integrations, or implementing reminder sequences.
- Do not add friction to registration flows as an attendance strategy. The data does not support the idea that harder registration produces more committed attendees. Payment does. Registration friction does not.
- Track both metrics. Registration completion and attendance rate measure different things and respond to different levers. A complete picture of event performance requires both.
Addendum: What we got partly wrong
Added September 1, 2026. Based on a follow-up analysis of 195 events with registration-level data.When we published this report, we concluded that payment rather than registration friction is the commitment filter that determines who shows up. That conclusion was drawn from a comparison between events: free events no-show at roughly 28%, paid events at roughly 17%.We have since run the same comparison inside individual events, between attendees who paid and attendees at the same event holding complimentary or free registrations. It is the test our original conclusion implied but never performed.
The effect is real, and it is much smaller than the phrasing suggested.
At the median event, paying attendees show up 2 to 4 percentage points more reliably than non-paying attendees at the same event. Depending on how narrowly non-paying is defined, paying attendees attend more reliably in 57% to 65% of events. In the remaining events, comped attendees show up more reliably than paying ones.
Compare that to the 11-point gap between free and paid events, and the picture changes. Being at a paid event predicts attendance about as strongly as personally having paid. What we described as an individual commitment mechanism is substantially a property of the event.
What this means in practice
Comping a seat at a paid event costs you far less attendance than the free-versus-paid event comparison implies. If you are deciding whether to extend complimentary registrations to members, students, or guests, the expected attendance penalty on those seats is a few percentage points, not eleven.
Conversely, converting a free event to a paid one is likely to do more for attendance than tightening comp policy at an event that already charges. The lever sits at the level of the event's pricing model, not the individual ticket.
What has not changed
Registration friction still does not predict attendance. Among paid events, no-show rates remain flat across every completion band and every ticket count we measured. The recommendation from the original report holds: do not add friction to registration as an attendance strategy.
Methodology note
The follow-up analysis covers 195 events with at least 50 completed registrations, at least 30 paid and 10 non-paying registrations, and a check-in-to-registration link rate above 90%. This is a stricter cohort than the original report, so absolute rates are not directly comparable between the two. The comparison above is between median no-show gaps in percentage points, which is.
This finding sits in the directional band of our publishing thresholds rather than the benchmark band, which is why it is published as an addendum rather than as a standalone report.
Download the Full Report
Download the full Event Data Lab report
Get the complete cross-referenced dataset, controlled comparisons, and detailed methodology notes.
This report is part of the Event Data Lab, an ongoing research initiative analyzing real-world event performance across registration, onsite operations, engagement, and ROI.
.png)

.png)
.png)
.png)