.png)
.png)
Programme committees spend more time on the session schedule than on almost any other part of an event. How many tracks, how long each slot runs, what goes head to head, how much content to offer at all. Those decisions are usually made on instinct, because almost nobody measures what attendees actually do with a programme once it exists.
Report #07 examined how attendees arrive at an event, and found that half of opening-day check-ins land inside a single hour. This report picks up where that one ends. In it, we analysed session check-in data across 411 live events to establish how many sessions attendees actually attend once they are inside, how that changes as the programme grows, and which scheduling decisions move attendance at all.
Executive Summary
- At the median event, an attendee who attends any session attends 5.5 of them. The interquartile range runs from 3.3 to 8.0 sessions.
- Roughly one in four people who check into an event never checks into a single session. Median session reach is 75% of event attendees.
- Session consumption rises far more slowly than session supply. Events offering 61 or more sessions see 8.2 sessions attended per person, against 3.3 at events offering 5 to 15. Quadrupling the programme buys about 2.5 times the consumption.
Dataset Overview
Dataset overview
- 411 live events with session-level check-in data
- 14,161 sessions with recorded attendance, drawn from 47,689 scheduled sessions
- 967,701 session check-ins
- Event durations of 1 to 14 days
- Test, sandbox, and internal events were excluded
- Sessions dated outside their event window were excluded
- Data aggregated and anonymised across live events
Metric definitions
Sessions attended per person is calculated as total session check-ins divided by the number of distinct attendees who checked into at least one session.
Session reach is the share of attendees who checked into the event who also checked into at least one session.
Attendance figures are based only on sessions with recorded check-in activity. Sessions where check-in was not operated are excluded rather than counted as empty.
What the Data Shows
Attendees Attend 5.5 Sessions
At the median event, an attendee who attends any session attends 5.5 of them.
Sessions attended per person
- 10th percentile: 2.2 sessions
- 25th percentile: 3.3 sessions
- Median: 5.5 sessions
- 75th percentile: 8.0 sessions
- 90th percentile: 10.3 sessions
The distribution across events is wide but not extreme. 21% of events see three sessions or fewer per attendee. 16% see nine or more.
This figure is stable. Restricting the analysis to events with more qualifying sessions, requiring higher check-in volume per session, or limiting to shorter events all move the median between 5.4 and 7.0.
One in Four Attendees Never Enters a Session
Median session reach is 75%. At the median event, a quarter of the people who checked in at the door never checked into a single session.
The spread is wide. At the 25th percentile, reach falls to 53%. At 32% of events, fewer than 60% of event attendees attended any session at all.
This number should be read as approximate rather than precise. It depends on event check-in as its denominator, and as Report #07 documented, door check-in is not operated with equal thoroughness everywhere. At 13% of events, more people checked into sessions than checked into the event. Those events are capped in the figure above, so the true reach rate may be somewhat lower than 75%.
Consumption Rises More Slowly Than Supply
The most consequential finding in this dataset is what happens when a programme grows.
Sessions attended per person, by sessions offered
- 5 to 15 sessions offered: 3.3 attended per person
- 16 to 30 sessions offered: 5.8 attended per person
- 31 to 60 sessions offered: 7.2 attended per person
- 61 or more sessions offered: 8.2 attended per person
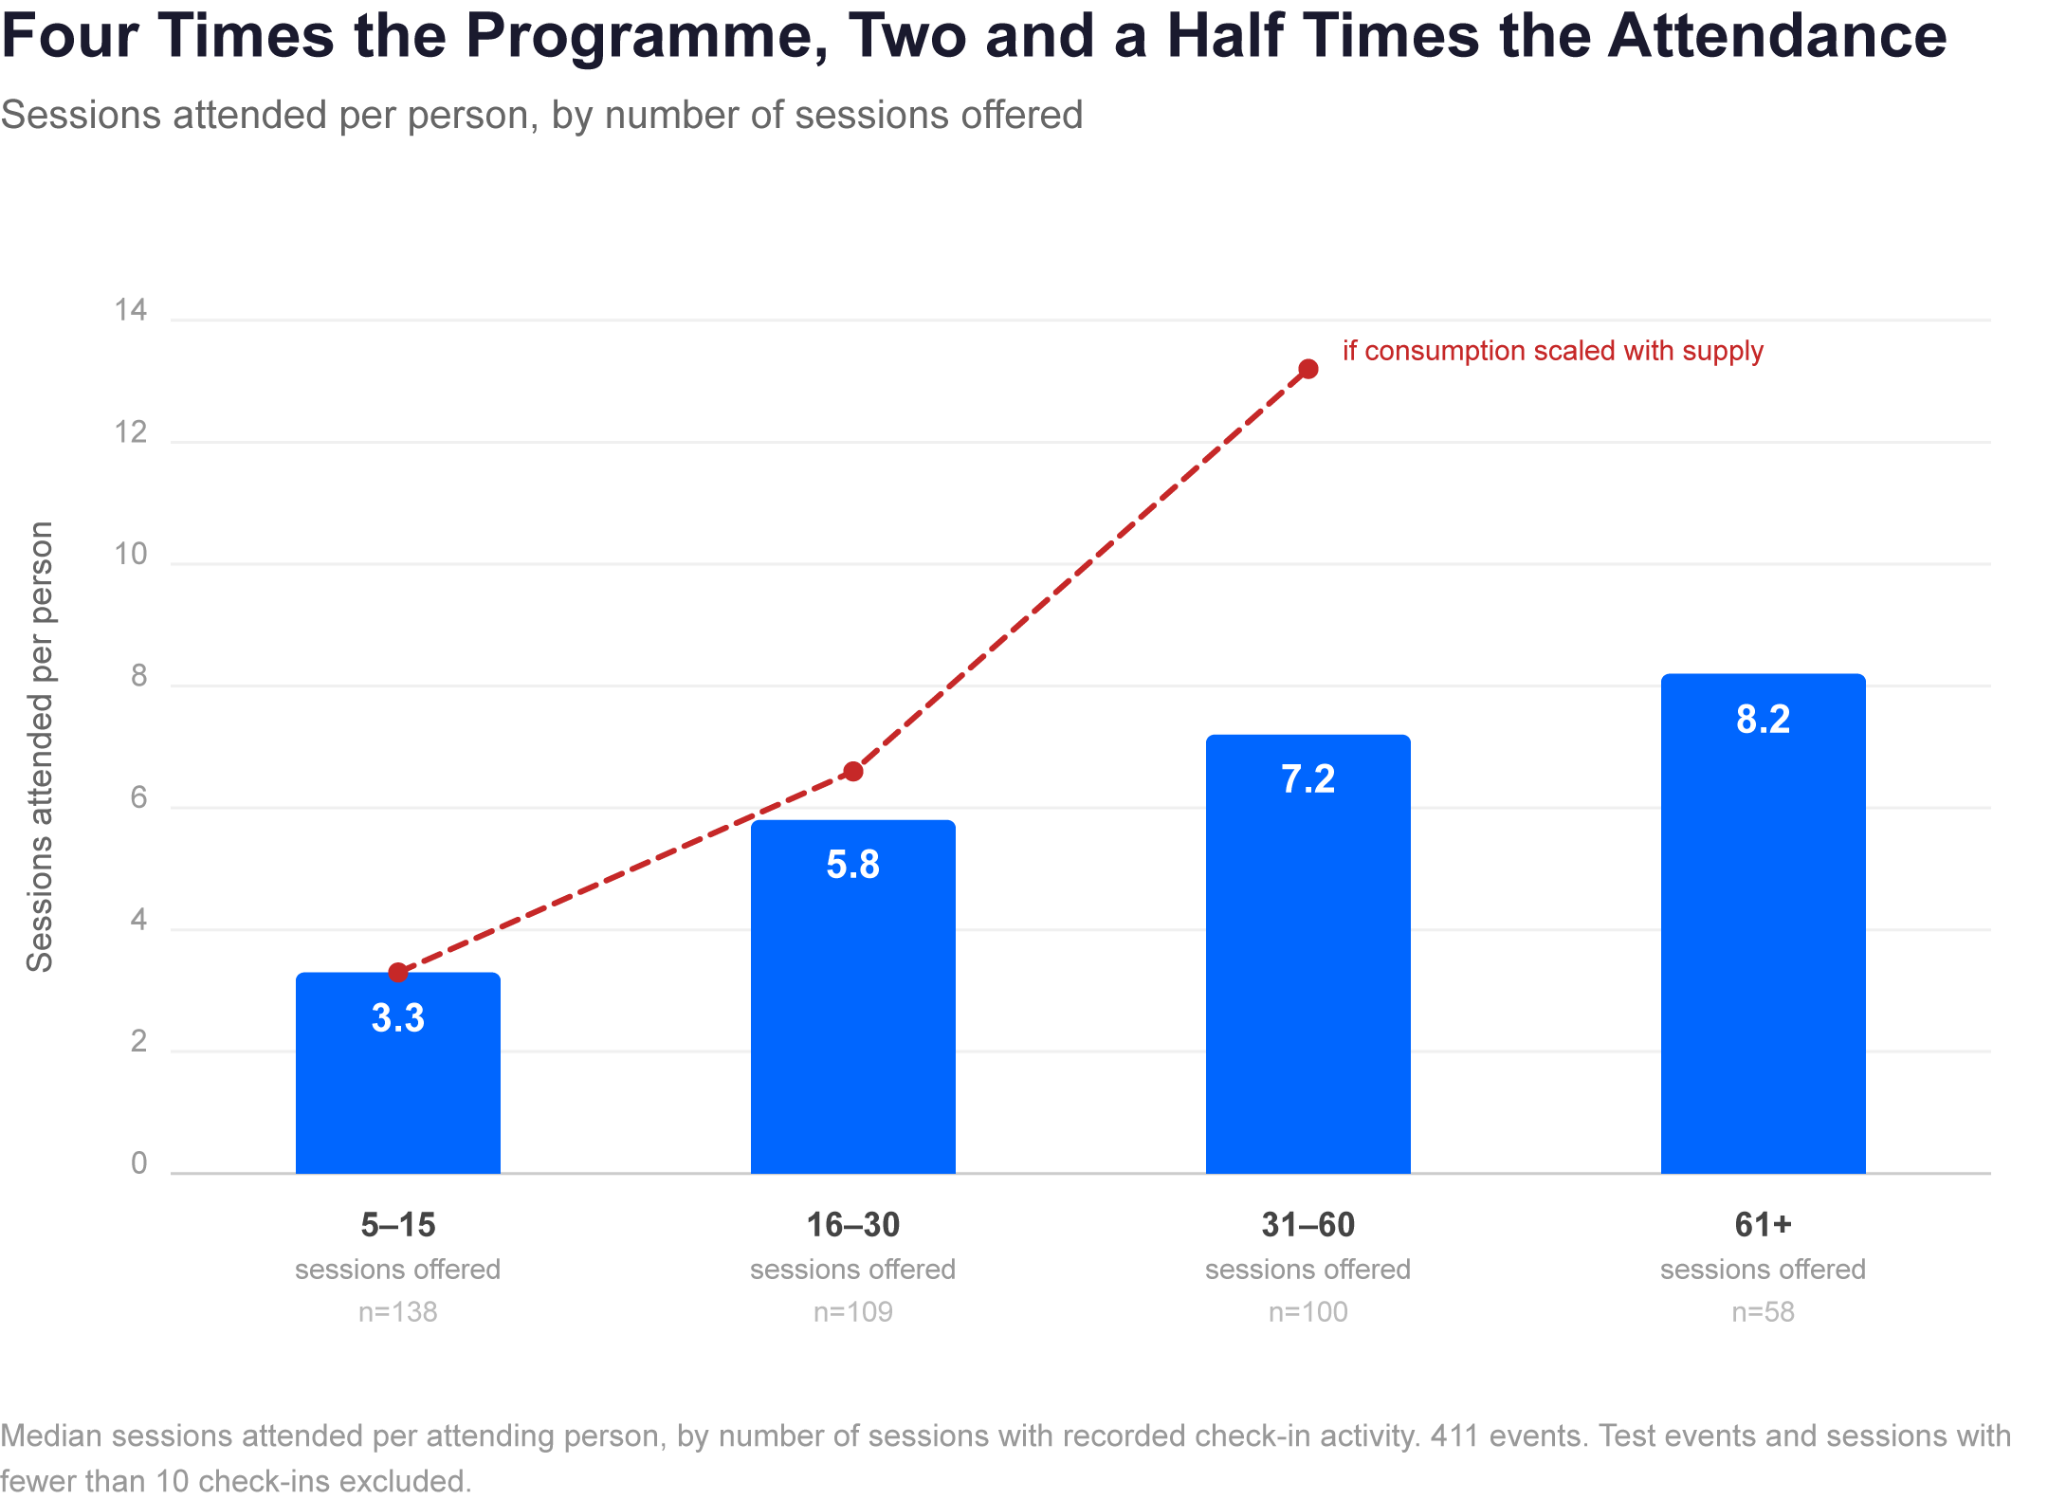
Going from roughly 10 sessions to roughly 80 is an eightfold increase in programme size. It produces roughly 2.5 times the consumption per attendee.
Event duration shows the same pattern. Single-day events see 3.7 sessions per person, two- to four-day events cluster between 5.4 and 5.9, and five-day events reach 8.4. More days and more content both help, and both help less than proportionally.
Attendees appear to have a session appetite that is fairly stable and not easily expanded. Each session added to a large programme competes for attention that has already been allocated.
Bookmarks Tell You How Much, Not Where
Attendees can add sessions to a personal agenda before the event. That data is often used to forecast room sizes.
Across 12,496 sessions with at least 10 agenda adds and recorded check-in activity, attendance as a share of agenda adds runs:
- 10th percentile: 37%
- 25th percentile: 58%
- Median: 90%
- 75th percentile: 134%
- 90th percentile: 220%
The median is close to accurate. Individual sessions are not. Only 28% of sessions land within 20% of their agenda count. 40% draw more people than bookmarked them. 18% draw fewer than half.
A planner sizing a room from agenda data is roughly as likely to be oversubscribed as undersubscribed, and the error in either direction is frequently large.
Attendance Is Flatter Than Expected
Within events, session attendance is less concentrated than programme debates tend to assume.
Across 328 events with 10 or more sessions carrying recorded attendance, the top 20% of sessions account for a median 38% of all session attendance. The bottom half account for 29%.
That is real concentration, but nothing resembling an 80/20 split. Attendance spreads across a programme more evenly than the attention given to headline sessions would suggest.
What Doesn't Move Attendance
Four scheduling variables that planners actively optimise show little or no measurable effect in this dataset. Attendance is indexed within each event, so each figure compares a session against its own event's typical session.
This is the third time this series has landed on a null result for something the industry treats as a lever. Report #03 found that custom registration form questions do not reduce registration completion at any question count, and Report #04 found that registration categories do not add friction either. The pattern across all three is that the variables receiving the most optimisation attention are frequently not the ones carrying the effect.
Time of day. 8am sessions index at 1.05, 10am at 1.01, 1pm at 1.00, 3pm at 0.98, 4pm at 0.91. A modest late-afternoon dip and nothing else. There is no post-lunch collapse.
Session length. Sessions of 30 minutes or less index at 0.97. 31 to 60 minutes at 1.00. 61 to 90 at 1.01. 91 to 120 at 1.00. Over 120 at 0.97.
Parallel tracks. Single-track slots index at 1.12, which mostly reflects that single-track slots are usually plenaries. Slots running 2 to 12 concurrent sessions index between 0.98 and 1.00. Adding tracks does not measurably dilute per-session attendance.
Day of the event. Indexed within each event against its own opening day, day 2 runs at 1.03, day 3 at 0.88, day 4 at 0.83. Decay exists and is modest, and the interquartile range crosses 1.00 on every day. Event-to-event variation is larger than the day-over-day effect.
Key insight: Session bookmarks tell you how much appetite exists, not where it will go. At the median session, attendance lands within 10% of the bookmark count. At the quartiles it lands anywhere between 58% and 134%.
Practical Implications for Event Teams
- Plan for roughly 5.5 sessions attended per attending person, and use the 3.3 to 8.0 range as your realistic band. This is a more useful planning input than total session capacity.
- Expect a quarter of your event attendees to skip the programme entirely. If session attendance is a stated goal, that gap is where the opportunity is, and it is not addressed by adding more sessions.
- Adding programme yields diminishing returns. Before expanding a schedule, consider that quadrupling session count historically produces about 2.5 times the consumption. The marginal session competes with your existing programme, not with empty time.
- Do not size rooms from agenda data alone. Use it to gauge total appetite, then build in capacity flexibility, because individual session forecasts from bookmarks are wrong in both directions more often than they are right.
- Time of day, session length, and parallel track count are not where attendance is won or lost. Teams optimising these variables are working on the margins.
Download the Full Report
Download the full Event Data Lab report
Get the complete dataset, the full interaction matrix between categories and tickets, and detailed methodology notes.
This report is part of the Event Data Lab, an ongoing research initiative analyzing real-world event performance across registration, onsite operations, engagement, and ROI.
More from the Event Data Lab
- What four reports and 3,600+ events reveal about registration friction. The choice architecture framework, with consolidated benchmarks and a registration optimisation checklist
- Report #07: Half of onsite check-ins arrive within a single hour. Arrival curves, peak concentration, and throughput
- Report #05: One in five registered attendees won't show up. No-show benchmarks by event size and pricing model
This report is part of the Event Data Lab, an ongoing research initiative analysing real-world event performance across registration, onsite operations, engagement, and ROI.
.png)

.png)
.png)
.png)