.png)
.png)
On July 8, about 80 event professionals spent a day with us at Boxcar Social Harbourfront for the first Horizons. It was our inaugural conference, which meant we had no attendance history to plan against, no prior year's feedback to correct for, and no idea whether people would actually give up a Wednesday in July for an event run by their event tech vendor.
They did. Here's everything that happened, including the parts we'd do differently.
We planned the day against our own benchmark
Worth saying up front, because it framed how we built the day.
Horizons I was free. Our own platform data says free events run a median no-show rate of 28%, and a free event of roughly this size runs higher than that. So we planned catering, seating, and staffing against expected attendance rather than our registration list. That is the entire argument of Event Data Lab Report #05, and it would have been strange to publish it and then over-order sandwiches for a registration count we knew wouldn't show up.
It worked. The room was full, the food ran out at roughly the right time, and nobody sat in an empty section.
Welcome, from PheedLoop’s President
George Wong, our President, opened the day. Short version of his framing: Horizons exists because we spend most of our time talking to customers one at a time, through support tickets and renewal calls and implementation kickoffs, and almost none of it talking to them all at once, in a room, where they can hear each other. That's a gap worth closing.
Event Data Lab: what 1,000+ events say about who actually shows up
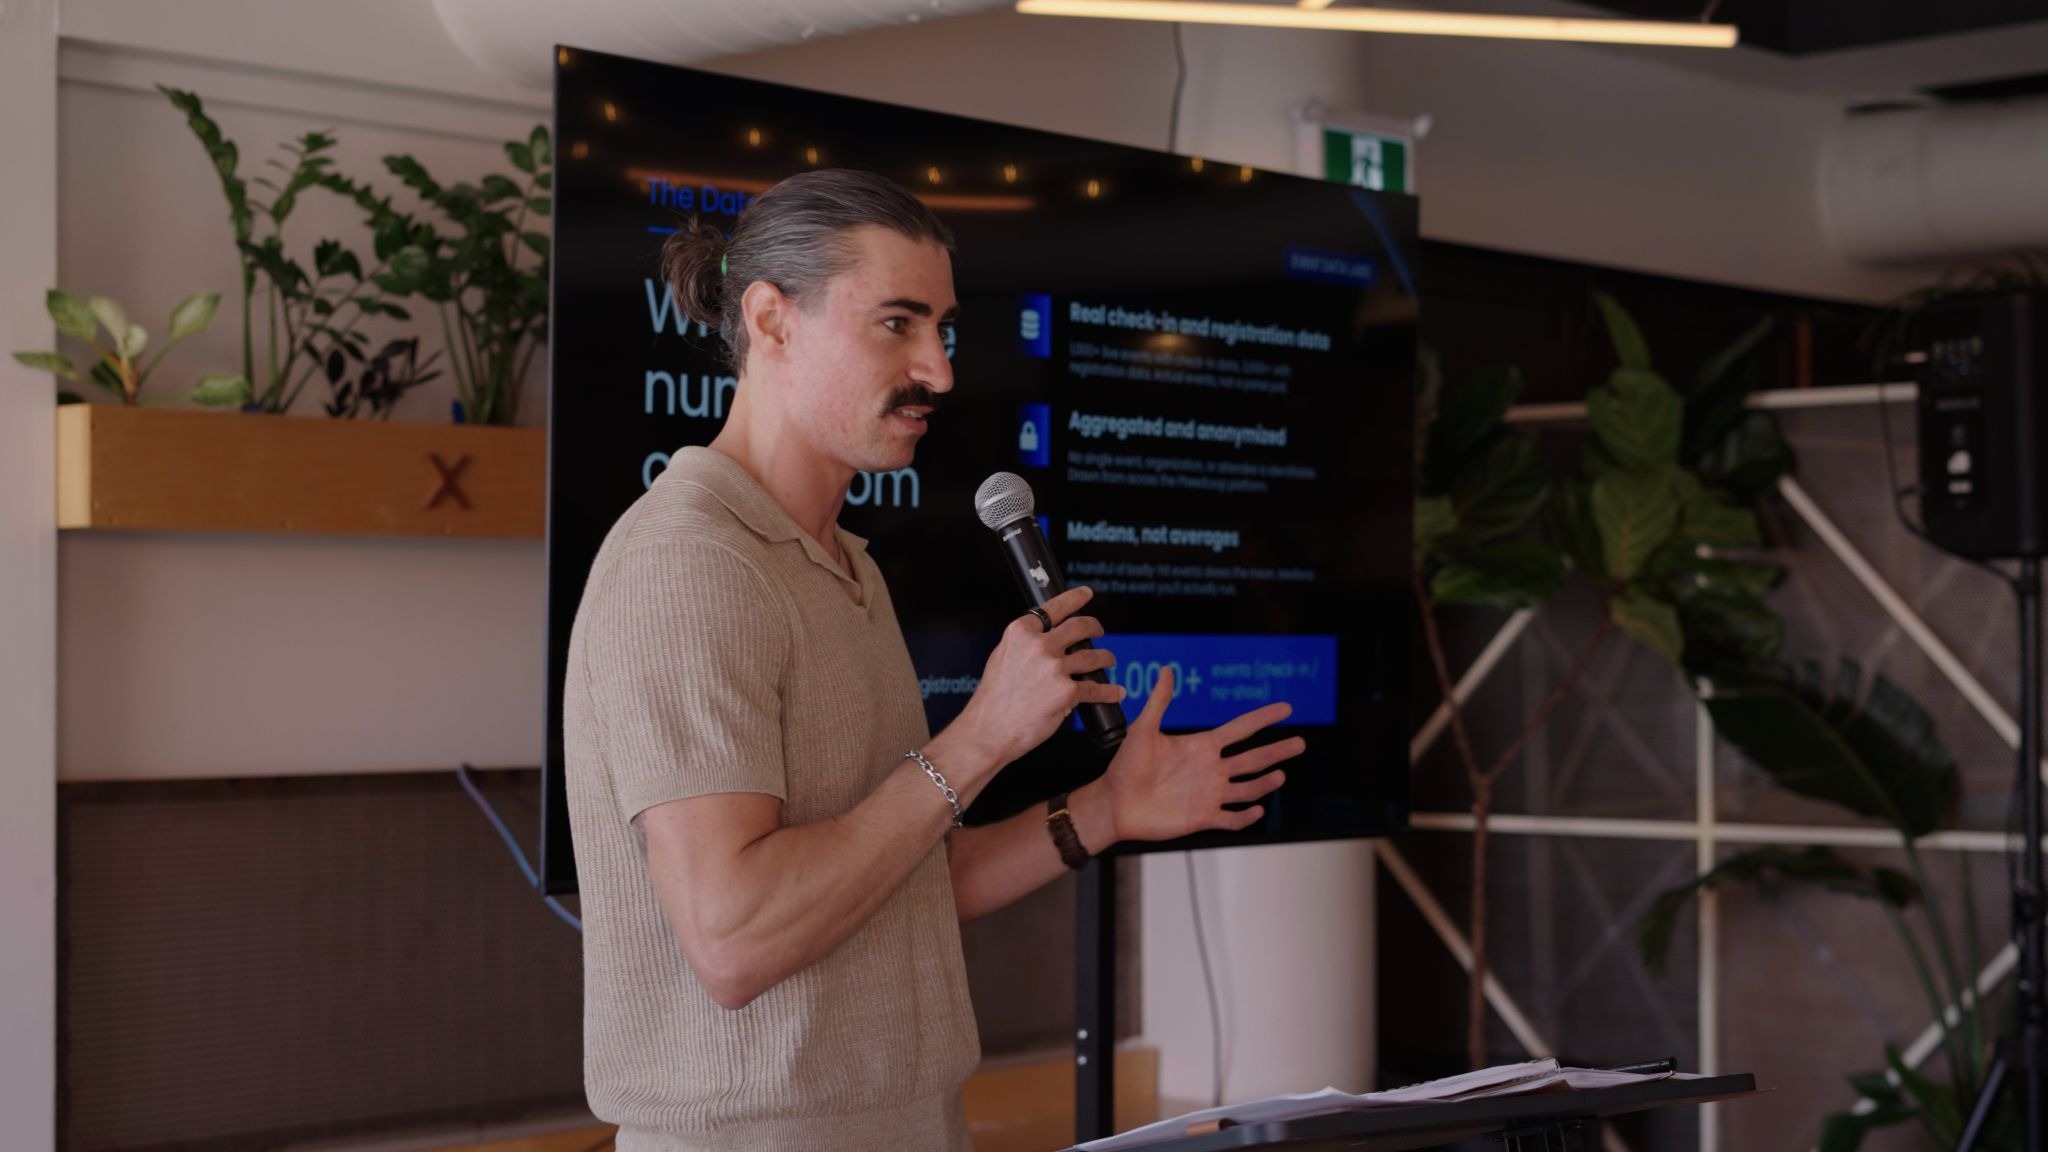
I took the first session, walking through what we're seeing across the platform.
The numbers come from 3,600+ events with registration data and 1,000+ events with check-in data, with 850+ having both. Aggregated and anonymized.
Finding #1, the baseline. The median no-show rate is 20%. The mean is 28%, pulled up by a tail of events that get hit hard. The practical version: plan for 80% of expected attendance at paid events and 70% at free ones. Registrations are a promise. Attendance is the number to plan against.
Finding #2, the twist. Events with the easiest registration have the worst attendance. Events where 90 to 95% of people who start the form finish it run a 28.5% no-show rate. Events where fewer than 70% finish run 18.2%. Which sounds like an argument for making registration harder, and it isn't.
Split the same data by free versus paid and the mechanism shows up, which is what Report #06 was built to test. Free events see 95.9% registration completion, a median of one ticket type, and a 28.0% no-show rate. Paid events see 85.5% completion, a median of eight ticket types, and 17.5% no-shows. It's not the form. It's the price. A no-show problem is a commitment problem, and the fix is a deposit, a fee, or an RSVP reconfirmation, not a shorter form.
Finding #3, what you actually control. This part builds on the first four reports. Every ticket option a registrant has to weigh costs you completion. It slides from 100% down to 83% as options pile up. Form questions, on the other hand, are close to free: events with 21 or more questions complete about as well as events with one or two. And organizing tickets into four or five categories lifts completion from 81% to 90%. Cut the choices, not the questions.
The takeaway is that completion and attendance are two different problems with two different levers. Completion is shaped by choice architecture. Attendance is shaped by financial commitment. Optimizing one doesn't cost you the other.
The panel: what's actually worth the budget
The data session covers where events leak money and attention. It doesn't tell you what to spend on. That was the panel.
I moderated, with Evan Babins, Sr. Manager, Events at PointClickCare, and Courtney McNamara, CEO of King Events. Two very different vantage points: an in-house corporate event lead and an agency owner running events for other people's budgets.
We planned for 30 minutes. The room didn't let us finish on time. The questions kept coming and we ran long, which is the version of a schedule problem you want. The recurring thread, across both panelists and the audience: the pressure isn't to spend more, it's to defend what's already being spent, and most teams don't have the measurement in place to do it.
Product updates: everything we shipped, and one thing we haven't
Liam Kennedy, PheedLoop’s Logistics lead, walked through the roadmap. Three parts.
Part one, the Design Studio. One studio, three canvases.
- Interactive Maps. Booths in one drag. The old four-step linking flow is gone, so dropping a booth onto the floor plan creates it and binds it automatically. Map layers let you focus on the elements that matter, and the legend is now customizable so you can colour-code by booth type, session location, or whatever your floor actually needs.
- Badge Designer. Badges now have a true front and back as separate pages, so two-sided badges get designed the right way up from the first draft. Perforations and hole punches are visible on the canvas while you work, and live preview shows every change as you make it.
- Seat Plans. Bulk-assign tickets to tables, or let attendees choose their own seat, depending on what the event needs. Eligibility rules enforce VIP and group seating automatically, and live occupancy colour lets you watch the room fill in real time.
Part two, the apps.
- PheedLoop Go 2.0. We rebuilt the attendee app around real usage data, customer feedback, and user interviews. Faster launch times, smoother transitions, and a navigation pass that reconsidered everything from colours to icon placement.
- PheedLoop OnSite. Device-level control for kiosks and printers. You can now build dedicated check-in flows for attendees, VIPs, speakers, exhibitors, sponsors, and reprints, then assign each flow to specific devices. Printers are set up in-app. Kiosks become branded touchpoints instead of generic terminals. Available now for all customers.
Part three, proving the return.
- Invite Lists. Organize invitees into targeted lists and send customized registration emails, each with its own template and a call to action that drops people straight into the right registration category. Open rates, click rates, and registration status are all tracked, so you can tune the messaging. Free for all customers.
- The Post-Event Report. Registration and attendance, check-in analytics, session performance, sponsor and exhibitor impact, financial outcomes, and more, in one place instead of pulled from five dashboards. Toggle sections on or off, or generate on demand. Available now at no extra cost.
And one thing we haven't shipped. We're rebuilding the place where events are planned, built, managed, and reviewed. Not a refresh. The revamped PheedLoop Admin Dashboard is coming later this year, it will be on mobile, and Horizons II is where you'll see more of it.
The town hall
We closed the program with an open town hall. George took questions with nothing scripted and no filter on what people could ask.
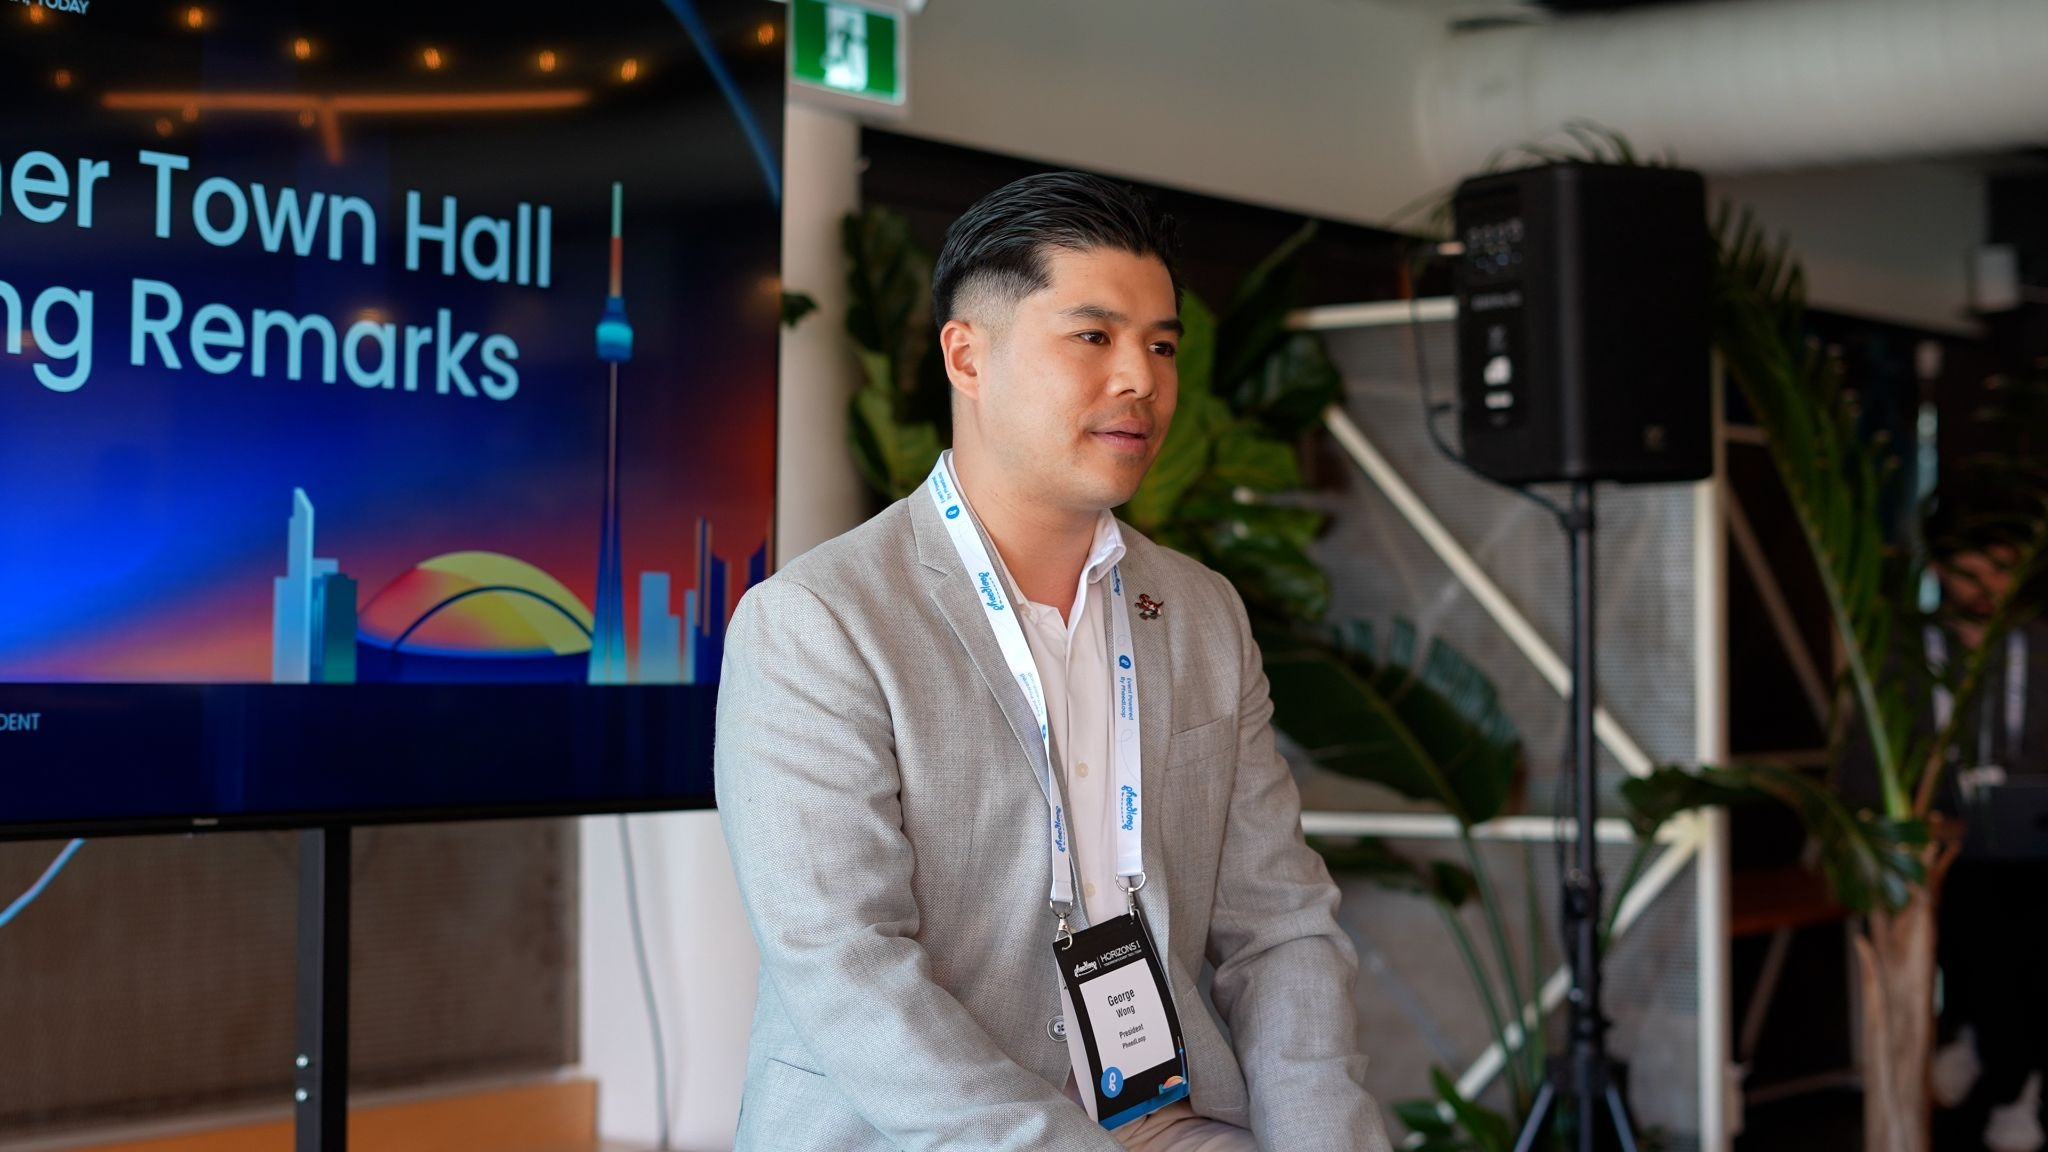
This was the part of the day we were least sure about and are most glad we did. Some of the feedback was flattering and some of it wasn't, and the unflattering feedback was more useful. If you're going to put your customers in a room together, giving them a microphone is the honest version of that. Otherwise you've just built a nicer webinar.
Horizons II is happening this September
We're doing it again, bigger, and with a different shape.
The format is moving to late afternoon / early evening. No one asked us to change it. We're testing it. A midday event and an evening event pull different people and produce a different room, and we don't have a strong prior on which one works better for this audience. Since we'll be sitting on the check-in and session data afterward either way, we'd rather run the experiment than guess. If the evening format holds attention better through the back half of the program, that's worth knowing, and we'll tell you what we find.
The program keeps what worked: a new Event Data Lab session with findings we haven't published yet, a customer panel, and a product update block.
Then it opens up. Instead of closing the program and moving straight to drinks, Horizons II runs an open dinner and networking block with three workshop stations running alongside it:
- Badge printing innovations. What's changed in on-demand badging, and how to stop your badge contract from being the most fragile part of your event.
- A town hall with our President. The Horizons I town hall was too good to bury at the end of a program. This time it's a station, so people can drop in and out and ask George whatever they want.
- Engagement strategies for on-site attendee engagement. Practical tactics for the hours attendees are actually in the building.
Registration for Horizons II is open here.
We’d love to see you in the room so if you’re interested in joining us, please register at the link above!


.png)
.png)